 Alright, take a deep breath as you are not going crazy.
If you’ve had to deal with the task of reporting your top ALL PAGES (or determining) for your web site in Google Analytics AND the trends of users, you may have created a report that looks something like this:
(note: modified data for example purposes)
(numbers rounded) (Example created to demonstrate discrepancy)
Highest ALL PAGES page: Homepage
48% exit after Homepage
14% go onto “website page 1”
13% go onto “website page 7”
12% go onto “About Us contact”
9% go onto “website page 8”
remaining = various
To locate this information you’ll want to take these steps:
CONTENT–>SITE CONTENT–>ALL PAGES
(This lists highest to lowest)
(click on highest page)
(then NAVIGATION SUMMARY (tab towards the top))
– look up “next page” paths
REPEAT for next highest pages
Now if you take a look at this report (image included), you’ll notice a few things:
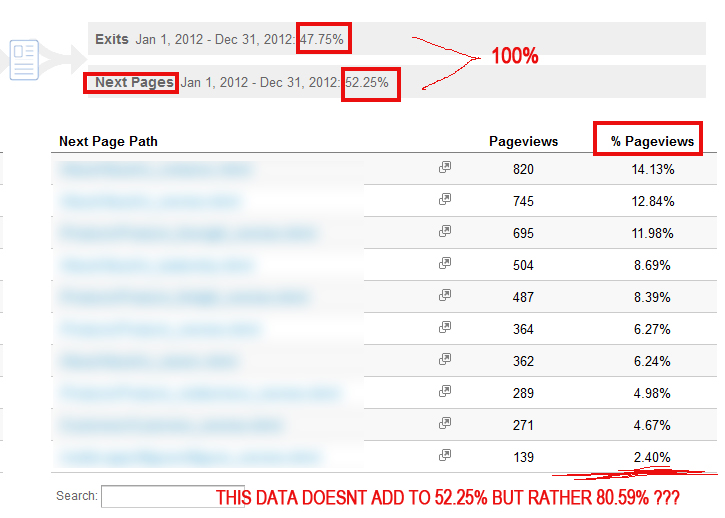
1- EXITS and NEXT PAGES add up to 100% (47.75% plus 52.25)
2- The #under the column % PAGEVIEWS, do not add up to the NEXT PAGES % of 52.25%, in fact they add up to more ….at 80.59% (huh what gives???)
This became an area of frustration for me, as it looks like either the calculation is off, or that you simply can’t add. So it required breaking down what’s going on here to a logical conclusion as to how GA is really handling this. I came up with 2 points of interest.
1- by default Google Analytics doesn’t report all the Previous and Next pages. So you are only seeing the top 10, the rest is hidden (which also means the number is even higher than the 80.59%!!! (huh???)
2- Google Analytics is treating its NEXT PAGES percent (which in this case is 52.25%) and breaking it down from 100% (100% of 52.25%, that is….)
Ok, I get it, so how do I get the NEXT PAGES percentage to be correct?
Easily enough, I created a quick calculator in Excel that you can use to recalculate.
Download the file here:
STEPS:
1- change the numbers in cells 2A thru 11A to the numbers from your “% Pageviews” under NEXT PAGES
2- In box 21A, type in your total percentage from NEXT PAGES (my example was 52.25%, though I rounded off to .52)
Thats it!, your corrected percentages are under column B
Which my report now looks like this:
Highest ALL PAGES page: Homepage
48% exit after Homepage
7% go onto “website page 1”
7% go onto “website page 7”
6% go onto “About Us contact”
5% go onto “website page 8”
remaining = various
This will get your numbers back to the correct percentages so that your presentation is showing the correct numbers!
Hi there, thanks for the helpful post, I’m trying to download your zip file but it just redirects to your home page?
sorry bout that, the link is fixed now ;)